SEGGER News
Welcome to the News section, your hub for the latest updates and insights from SEGGER.
- J-Link

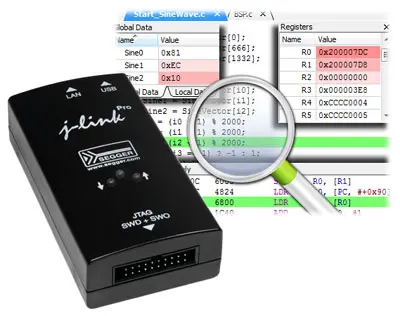
Powerful J-Link Debugger software now included with advanced J-Link models
In addition to standard debugging features like C source and assembly level debugging, J-Link Debugger also supports high-end debugging techniques such as SEGGER's Real Time Terminal (RTT) for unique, bidirectional, high-speed Terminal I/O (printf), setting an unlimited number of breakpoints even when debugging in flash memory, instruction trace, and ultra-fast flash download with J-Link/J-Trace. In addition to SEGGER RTT, other basic terminal I/O techniques like ARM's Serial Wire Output (SWO) and semihosting are also supported.
J-Link Debugger can load applications/ELF files built with any compiler or even debug the target’s resident application without any source files being available.
It is also fully controllable via script files making it the perfect solution for automated test setups. Instruction trace is also available in J-Link Debugger, allowing to view the stack of most recently executed machine instructions. This allows a better means of debugging complex problems and bugs.
The J-Link Debugger has been designed specifically for the advanced set of SEGGER’s industry-leading J-Link debug probes.
This includes the J-Trace, J-Link PRO, J-Link ULTRA+, and J-Link PLUS. Other J-Link models may be used with the evaluation version of the J-Link Debugger.
More information on J-Link Debugger is available at: https://segger.com/j-link-debugger.html