Overview
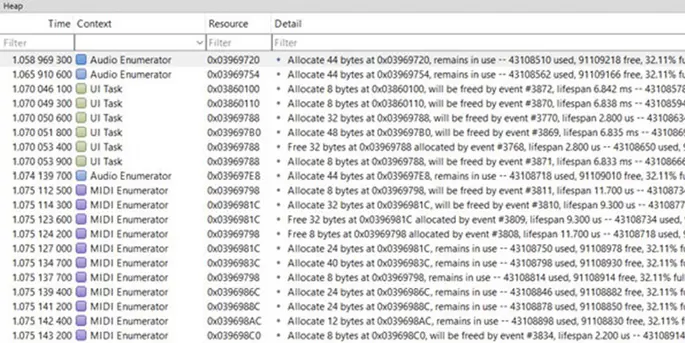
SystemView has the capability to monitor how applications use dynamic storage. This means that if your application uses the C or C++ heap, multiple custom heaps, or memory pool objects offered by an RTOS, you can trace how these are used over time. SystemView can monitor each of these within the same application, analyze their usage patterns, and present the collected information in a format that allows you to assess the load on your heap, identify potential memory leaks, track peak memory usage, and more.
Heap metrics
SystemView maintains a model of the underlying heap, ensuring its state is always known. It records every active allocation and deallocation, calculates and tracks heap loading, and pairs allocation events with their corresponding deallocation events. In the Heap or Events window, you can navigate between allocation and matching deallocation events, view the lifetimes of each allocated memory block in the heap, and monitor both peak and current heap loading to ensure sufficient heap space for your needs.
User-defined tags
Each block of memory can be tagged, with the meaning of the tag left to the user's discretion. Typically, the tag identifies the application subsystem that owns the memory block within the heap (for example, a transmission layer, a protocol layer, or a database). This tag is maintained in the SystemView application, so it imposes no additional strain on the target. It is simply not stored in the target memory, aligning with SEGGER's philosophy of minimizing resource requirements on the target. You can use the tag as needed, filter based on it, and monitor blocks allocated for specific, application-defined purposes.
Named resources
Heaps and memory blocks can be given names, making it easier to identify specific blocks in the SystemView trace. These names are not stored on the target; instead, they are maintained within the SystemView application. SystemView ensures that any named resources in an API call or in the Resource column of a view display the human-friendly resource name.
Locating memory leaks
SystemView's heap monitoring makes it visually obvious when memory has been allocated but not freed. In many cases, this is perfectly acceptable—long-lived objects can persist for the entire lifetime of an application without needing to be freed. However, if you notice the peak load of the heap increasing over time, you are likely experiencing a memory leak, which can eventually cause problems and lead to a crash. With the heap monitor, it’s easy to track when objects are allocated along the timeline, providing useful clues as to where the leak may be occurring.
Instrumenting your own heaps
Adding instrumentation to your own heap-like objects is a snap! You define the characteristics of the heap once, using SEGGER_SYSVIEW_HeapDefine() and monitor its use with SEGGER_SYSVIEW_HeapAlloc() and SEGGER_SYSVIEW_HeapFree(), which are naturally inserted into heap allocation code.
Get in touch with us
Have questions or need assistance? Our Embedded Experts are here to help!
Reach out to us for:
- Licensing quotes
- Technical inquiries
- Project support
