Ozone
Debugger and performance analyzer

Overview
Ozone is a full-featured graphical debugger for embedded applications. With Ozone, it is possible to debug any embedded application on C/C++/Rust source and assembly level. Ozone can load applications built with any tool chain / IDE or debug the target's resident application without any source. Ozone includes all well-known debug controls and information windows and makes use of the best performance of J-Link and J-Trace debug probes. The user interface is designed to be used intuitively and is fully configurable. All windows can be moved, re-sized and docked to fit the need of any developer.
Ozone is more than a simple debugger. Its various features, including trace, code profiling and code coverage analysis make it a powerful performance analyzer, enabling you to get full system insight, to track down inefficiencies and bugs, and to make your products even better.
Key features
- Stand-alone graphical debugger
- Debug output of any toolchain and IDE
- Rust support
- C/C++/Rust source level debugging and assembly instruction debugging
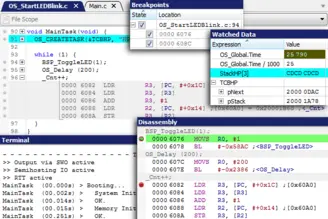
- Debug information windows for any purpose: disassembly, memory, globals and locals, (live) watches, CPU and peripheral registers
- Source editor to fix bugs immediately
- High-speed programming of the application into the target
- Direct use of J-Link built-in features (Unlimited Flash Breakpoints, Flash Download, Real Time Terminal, Instruction Trace)
- Scriptable project files to set up everything automatically
- New project wizard to ease the basic configuration of new projects
All-in-one solution
Ozone supports Arm-based and RISC-V microprocessors. With J-Link tightly integrated, all devices supported by J-Link can be used with Ozone.
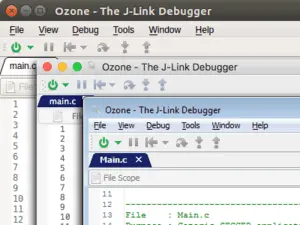
Ozone is multi-platform for Windows, macOS, and Linux. Similar look and feel on all platforms and fully portable projects enable efficient development on the operating system of your choice.
Supported toolchains
Ozone can be used with any toolchain that generates Elf/Dwarf debug information for its output. The list of tested toolchains and IDEs includes Embedded Studio, and other GCC and GCC-based IDEs, clang/LLVM and Arm Compiler.
Toolchain not listed? Please don’t hesitate to contact us.

Rust support
Ozone includes comprehensive support for the Rust programming language. This integration provides important features such as source and assembly-level debugging, system state inspection with memory view, call stack, and backtrace analysis, now also available for Rust.
Stand-alone debugger
Ozone focuses on debugging. There is no compiler or project window to distract you from your work, All debug windows can be moved, resized and docked to provide you with the workspace you need.
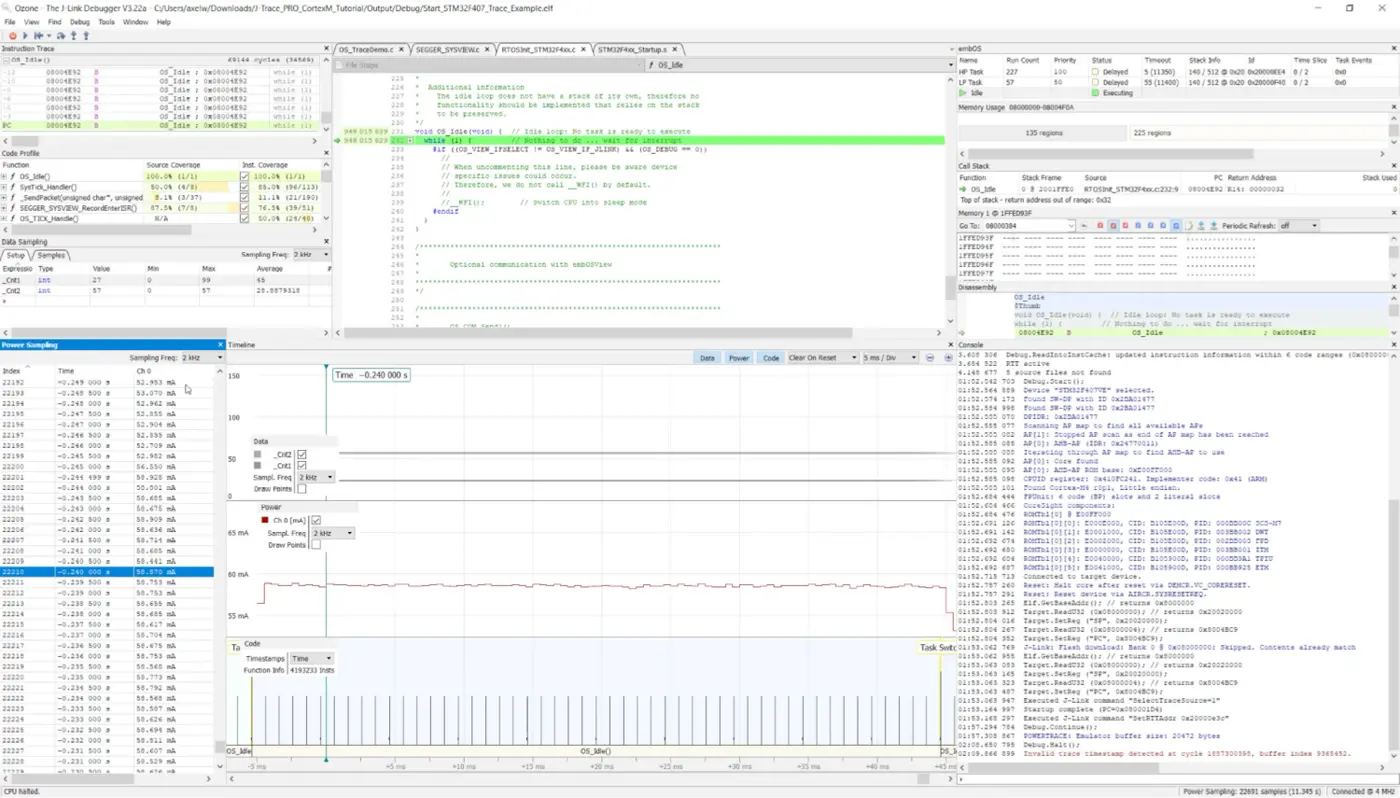
Ozone offers all well-known debug controls and information windows, and more. Instruction trace, power graph, live watches, and real-time terminal I/O further extend these capabilities.
With the source editor you can fix bugs immediately on detection.
The performance analyzer
Ozone features more than plain debugging. With the extensive features of J-Link and J-Trace, it can be used for a full performance analysis of your target system.
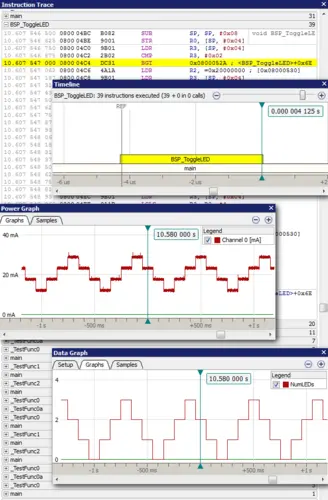
In combination with J-Trace, Ozone can record and analyze the runtime behavior of your application. You can step back through the executed instructions to see what your system did last and to visualize, in a timeline, the function and interrupt call path. Additionally, the execution is analyzed to provide a complete code coverage and profiling analysis.
With J-Link's High-Speed Sampling technology, Ozone allows you to sample and visualize your system's variables over time and to easily check values and flags in the debugger, while the target keeps running.
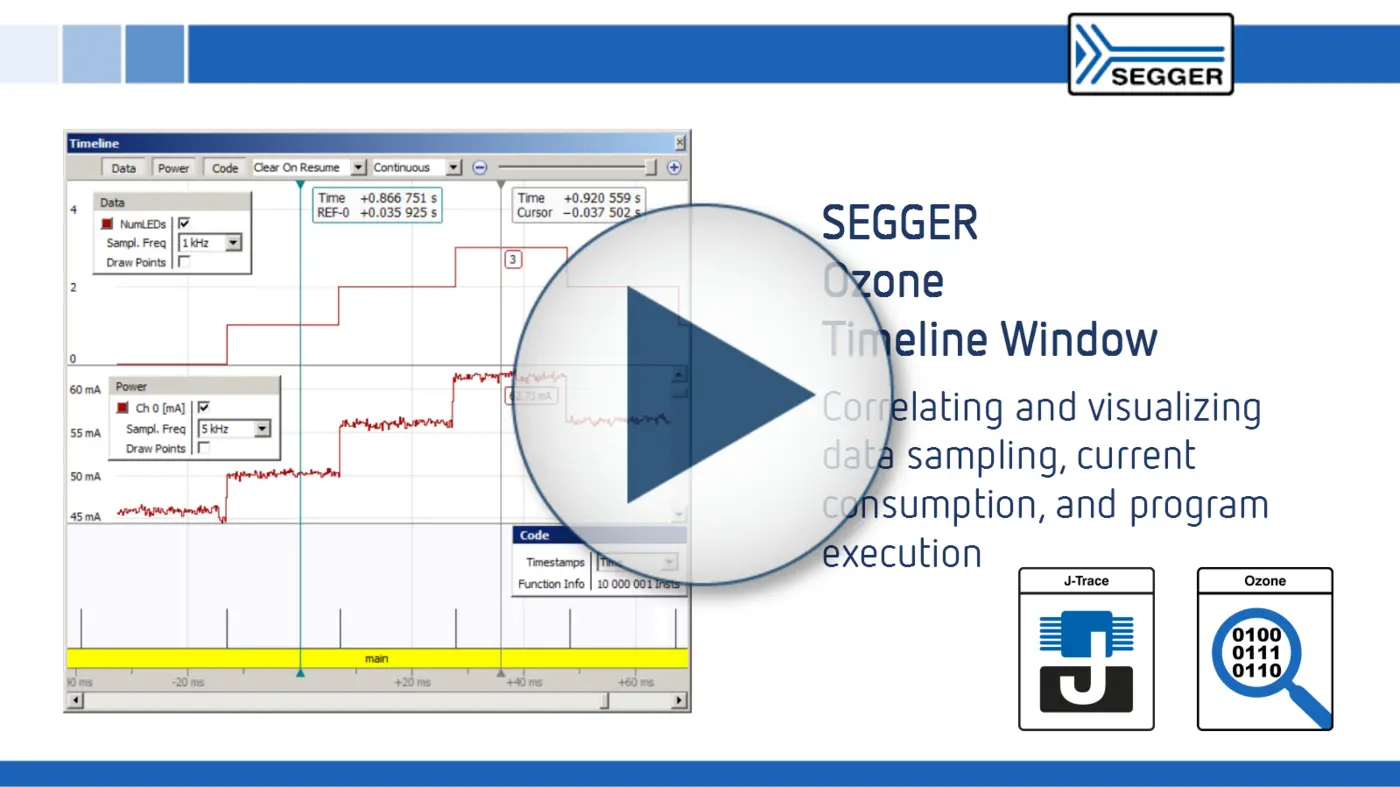
J-Link's power measurement features enable you to record the power consumption of your target device in a debug session. This is especially helpful when you develop a low-power device and need to know how power consumption changes when you enable or disable certain components.
All performance analysis windows can be synchronized to get the link between them. Want to know why your error flag was set? Check the Data Graph and Instruction Trace windows. Want to see what happens when you turn on the display? Take a look at the Timeline and Power Graph.
Get system insight
In addition to analyzing runtime performance, Ozone also provides detailed information about the state of your system when it is halted.
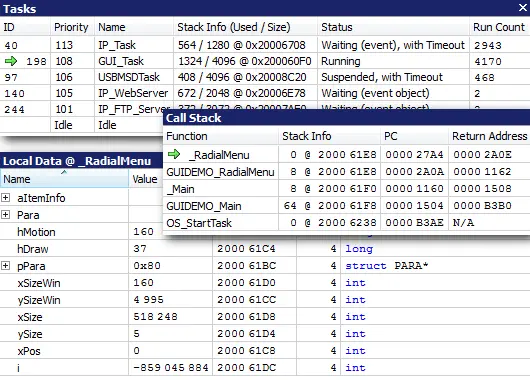
With its RTOS awareness, Ozone provides you with information about the OS of your application: In which task did the system halt? What are other tasks currently doing? How much stack does each task use?
Ozone comes with RTOS awareness plugins for embOS and FreeRTOS. A plugin SDK is available for you to add awareness for your OS.
Automate your setup & tests
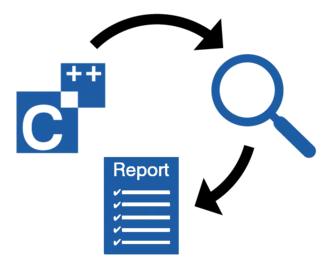
Ozone projects feature a C-like scripting language that allow you to configure the graphical user interface and to automate the debugging work flow. Most actions that are accessible with the GUI have an affiliated script function that can be evoked from your project script or manually from the debuggers console window.
In a project file you can use various event handlers to perform your actions on certain events, such as on debug start, before download, after reset, or on halt and go. You can also add event handlers to your breakpoints. Using this functionality, you can configure consistent, comprehensive verification and debug setups. This enables automated tests that simply work without user interaction.
Licensing
Commercial use
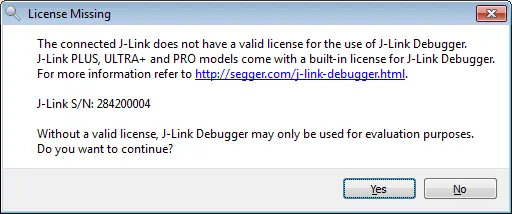
Ozone can be used in a commercial environment as part of the licence for J-Link PLUS, ULTRA+, PRO and J-Trace. With J-Link BASE, Ozone can be used commercially after purchasing the J-Link BASE to PLUS upgrade bundle, that includes the Ozone license. With other J-Link models, Ozone remains in evaluation mode and presents the following screen each time a debug session is started:
Free for non-commercial use
Like most of our software, Ozone can easily be downloaded and installed without any registration process. For non-commercial use or evaluation, Ozone is available to be used free of charge. With a J-Link PLUS, PRO, ULTRA+, or with a J-Trace, Ozone is available for free.

Download & Installation
Download the setup and install Ozone with a few clicks. Multiple versions of Ozone can be installed on the same PC without any problems, as they can co-exist in different directories. Application settings are shared across the versions.
System requirements
Operating systems
| Operating system | Version |
|---|---|
| Windows | Microsoft Windows (Arm/Intel) |
| macOS | macOS (Apple/Intel) |
| Linux | List of supported Linux distributions: https://kb.segger.com/Ozone_Tested_OS_versions_%26_distributions |
Optional components
In order to properly use Ozone, please make sure you have the latest J-Link Software Package installed. Downloads for all platforms and installation instructions can be found on the J-Link download page.
