Graphical debugger with J-Link/J-Trace integration
Embedded Studio integrates a feature-packed graphical debugger with J-Link/J-Trace integration for direct debugging and analysis on your target hardware. All well-known J-Link features can be used with Embedded Studio.
- Seamless J-Link/J-Trace integration
- Use of advanced J-Link technology
- Core simulator

Debugging your Application
After you have built your Application you can load it onto your target hardware and examine its execution.
- If not already done, select J-Link instead of Simulator.
Open Project Options, Debugger -> Target Connectionand select J-Link. - Start Debugging with
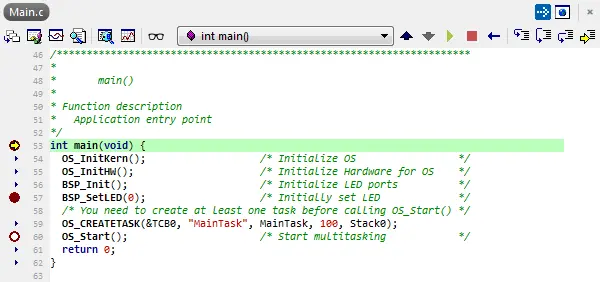
Debug -> Go. Instead of running the Simulator Embedded Studio will now download the application into the memory of your target. After downloading it runs to main(). When it reaches main you can see the line highlighted in the Source Code Editor and pointed to by an arrow Icon. - Let it run (
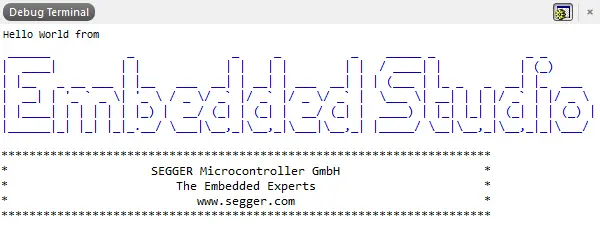
Debug -> Go)and you will see the printf output in the Target Terminal. When the application is finished at the exit_loop, stop the debug session (Debug -> Stop). - You can let your application run, step through it, set Breakpoints and examine the execution of your Application.
Debug Information Windows
The Debugger features various debugging windows, useful for gaining advanced information about the application and its execution. It includes mixed-mode disassembly in addition to the source code, an I/O Terminal for semihosting, SWO and SEGGER's Real-Time Terminal, scriptable RTOS awareness, examples for embOS and FreeRTOS included, to show running task information, and advanced profiling and trace windows.
Source Code Editor
The most used window is the Source Code Editor. In Debugging Mode it shows you where your application is currently halted. You can set Breakpoints in the Code on lines which are marked with a small blue Arrow by setting the cursor into the line and selecting Debug → Toggle Breakpoint (F9) or clicking on the arrow. A black dot marks lines on which a breakpoint is set and when the Application reaches this line it halts execution. You can directly get information about the symbols in your application, by moving your mouse over them. The mouse-hover box shows you the value of the symbol. The right-click context menu provides some more useful actions, like running to the current cursor position or setting the next execution statement to the current cursor.
Debug Terminal
The Debug Terminal displays output from the target application, for example done with printf and RTT. The output can be formatted by the application with ANSI Escape Sequences to for example change text and background color.
Embedded Studio includes support for output via RTT, SWO, DCC, and Semihosting.
With Semihosting the standard I/O operations are supported, enhanced by host-based formatting for smallest embedded applications.
Symbol Watch Windows
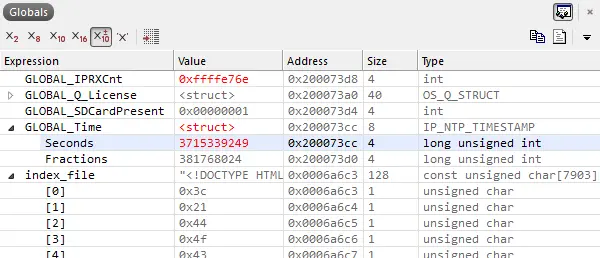
Embedded Studio includes different Watch windows used to monitor variables. The Locals window displays the local variables and parameters of the current function. The Globals window displays the global variables of the application. The Autos window displays the variables which are important in the current context. To the Watches window you can add any Variable and display them regardless of the current function (if they are available).
C++ Type Awareness
Embedded Studio features type awareness for C++ template container types. Containers, such as std::list, std::map, and std::array, as well as custom container classes, can be displayed in easy to understand human-readable lists instead of in their internal implementation form.
Type interpretation files for container types in the C++ standard library are included in Embedded Studio (e.g. $(StudioDir)/bin/libc++.xml). Custom container interpretation can be easily constructed in a structured XML file.
More information: https://studio.segger.com/ide_type_interpretation_file_format.htm
Threads Window
The Threads window allows OS aware debugging. When you are debugging a (real time) OS like → embOS, the Threads window can show the running Tasks / Threads of your Application and their status. With a double-click on a Thread you can switch to it to examine its Registers and Call Stack. To be able to show Thread Information Embedded Studio requires a Threads Script for your OS. This can be part of your Project and set in the Project Properties. If you do not already have a script for your OS it can be easily written in JavaScript. FreeRTOS and embOS are currently supported.
Registers Window
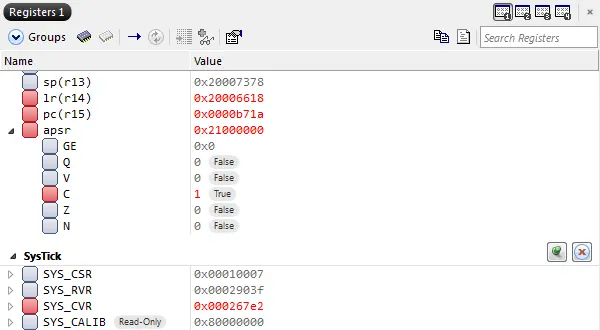
The Registers window shows the CPU Registers as well as Memory Mapped Registers (MMRs, Peripheral Registers). You can select which Register Groups should be shown and also hide single Registers. Registers can be shown in different numerical formats or extended to their bit-fields. You can also modify Register Values directly in the Registers window. When stepping through your Application changed Register Values are highlighted for easy identification.
Embedded Studio allows you to show up to 4 Registers windows, which can be used to view different Register Groups in different windows.
Call Stack Window
The Call Stack window shows in which function the application is currently halted and its callers up to the top level. You can double-click on each caller to examine the exact location of the call and get additional information about the calling function, like its local variables. If you are debugging with OS awareness, the Call Stack window will show the call stack of the selected task.
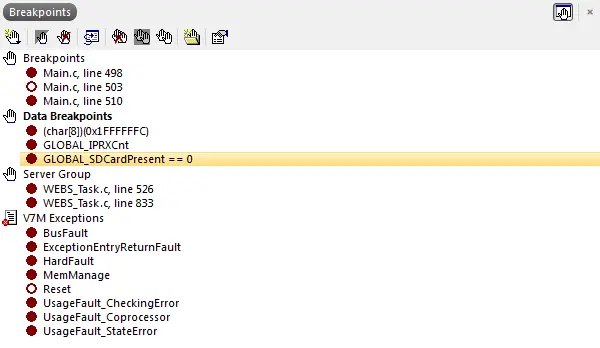
Code and Data Breakpoints
The Embedded Studio debugger features code breakpoints on instructions, functions, and source lines, as well as data breakpoints upon access of variables in memory.
Additionally breakpoints can be set with simple C-like expressions. For example, the expression x == 4 will breakpoint when x is accessed and its value is 4. The operators <, >=, >, >=, ==, and != can be used similarly.
You can also use the operator '&' to mask the value you wish to break on, for example, (x & 1) == 1 will breakpoint when x is accessed and has an odd value, or you use the operator '&&' to combine comparisons. For example (x >= 2) && (x <= 14) will breakpoint when x is accessed and its value is between 2 and 14. You can specify an arbitrary memory range using an array cast expression. For example, (char[256])(0x1000) will breakpoint when the memory region 0x1000–0x10FF is accessed.
You can specify an inverse memory range using the ! operator. For example !(char[256])(0x1000) will breakpoint when memory outside the range 0x1000–0x10FF is accessed.
