SEGGER News
Welcome to the News section, your hub for the latest updates and insights from SEGGER.
- SystemView

SystemView: Maximum insight with free real-time analysis tool
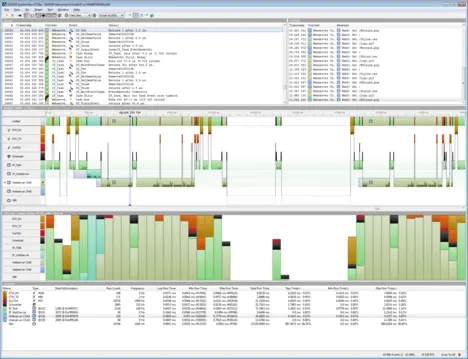
SystemView offers cycle accurate tracing of interrupts and task start stop as well as task activation and API calls when an RTOS is used. It visualizes and analyzes CPU load by task and interrupts and scheduler. Test setups with LED and oscilloscope are a thing of the past.
Using SEGGER's J-Link debug probe with SystemView gives the ultimate advantage of streaming data transfer: Unlimited recording capacity and analysis in real-time, working as a live software oscilloscope. This is a great means to gain a deep understanding of the runtime behavior of an application. Real-time analysis is particularly beneficial when developing and working in complex systems with multiple threads and events, and also in bare-metal systems without any RTOS.
In order to ensure real-time delivery of data and minimal intrusiveness on the system – that means less than 1 µs overhead per call on a 200 MHz Cortex-M System - SystemView makes use of SEGGER’s unique Real-Time Transfer (RTT) technology. RTT enables up to 2 Mbyte per second data transfer for continuous extraction of real-time data, requiring no hardware but a J-Link and the standard debug interface.
SystemView records the data retrieved from the target and visualizes the result in different ways. Data recordings can also be saved for later documentation and analysis. Evaluating a system this way is extremely helpful in finding and eliminating problems or simply optimizing the system. It is an essential part of quality management in any professional software development.
SystemView interacts seamlessly with SEGGER's RTOS embOS, which already includes the instrumentation to call the recording functions. SystemView does not require any OS at all.
For further information on SystemView and the functionality of the different modules in the package, please visit https://www.segger.com/systemview.html. SystemView can be downloaded here, too.
About J-Link
The SEGGER J-Link is the most popular family of debug probes on the market. It is tool chain independent and works with free GDB-based tool chains as well as commercial IDEs. With the J-Link family, investments in the debug probe are preserved when changing compiler or even CPU architecture.
J-Link supports multiple CPU families; there is no need to buy a new J-Link or new license when switching to a different yet supported CPU family or tool-chain. All J-Links are fully compatible to each other, so an upgrade from a lower-end model to a higher-end model is a matter of a simple plug-and-play.
Full product specifications are available at: www.segger.com/jlink.html
The J-Link-Software is available at: www.segger.com/download_jlink.html