SEGGER News
Welcome to the News section, your hub for the latest updates and insights from SEGGER.
- SystemView

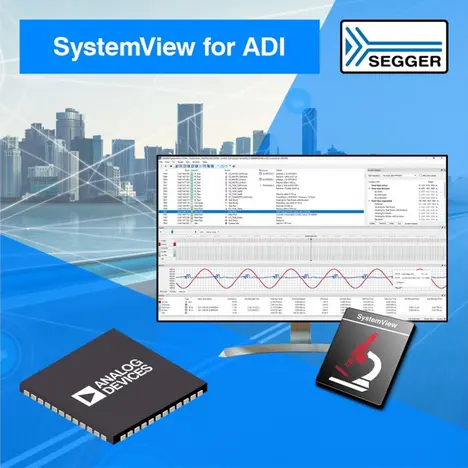
SEGGER SystemView Now Free for Select Ultra Low Power Microcontrollers from Analog Devices
SystemView is a real-time recording and visualization tool for embedded systems that reveals the true runtime behavior of an application, going far deeper than the system insights provided by debuggers. This is particularly effective when developing and working with complex embedded systems comprising multiple threads and interrupts. SystemView can ensure a system performs as designed, track down inefficiencies, and find unintended interactions and resource conflicts.
ADI’s ULP microcontrollers enable edge nodes to process local data intelligently while minimizing power consumption. This extends battery life and reduces the frequency of charging, thereby offering prolonged usage periods. In addition, ADI’s ULP Artificial Intelligence (AI) microcontrollers with a built-in neural network hardware accelerator perform AI inferences hundreds of times faster and uses less energy than other embedded solutions.
“At ADI, we are committed to solving our customers’ toughest challenges and accelerating their time to market,” says Jason Griffin, Managing Director, Software and Security Group at ADI. “By providing our customers access to SystemView, we are further delivering on our promise of making their development lives easier by helping them reveal the intricate runtime behavior of embedded systems."
“We are excited to collaborate with ADI in providing extended verification options to their customers,” says Dirk Akemann, Head of Technical Marketing at SEGGER. “With streaming data transfer via debug interface and real time data analysis, J-Link and SystemView together provide a clear advantage for development as well as for the verification and optimization process. We are sure that ADI’s customers will love this must-have package!”
Especially helpful when working with sophisticated MCUs such as those from ADI is SystemView’s new DataPlot window. It enables users to record and visualize custom data samples over time, alongside runtime information events. The DataPlot window presents a visualization of the recorded data in oscilloscope-style graphs, which are synchronized with SystemView's Timeline and CPU Load windows. This provides a trace of each measurement over time with at-a-glance verification or diagnosis of system response, ultimately helping to verify system behavior or pinpoint events causing unwanted behavior.
SystemView is available on all platforms (Linux, macOS, and Windows) on Arm, Intel, and Apple Silicon.
For more information, please visit www.segger.com.