Debugging an embedded system—why is it crucial?
Debug and trace probes are essential tools for embedded development, enabling engineers to test, analyze, and optimize code directly on microcontrollers and other embedded systems. SEGGER’s J-Link and J-Trace models provide high-performance solutions for real-time debugging, breakpoint setting, and comprehensive trace analysis, giving developers deep insight into applications. With these tools, users can identify issues quickly, monitor program execution, and optimize the development process — all of which ensures efficient and reliable product performance.
SEGGER's debug and trace probes support a wide range of devices and development environments, making them versatile choices for embedded projects of all types.
J-Link debug probes

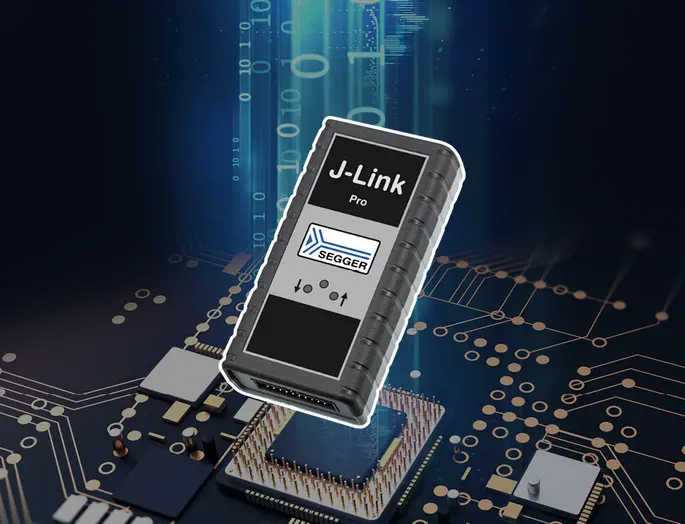
SEGGER J-Links are an industry-leading line of debug probes for embedded systems development. Known for their exceptional speed, reliability, and versatility, J-Links have become the go-to tools for developers around the world. For over a decade, these probes have been essential in enabling efficient debugging, programming, and performance analysis across a broad range of embedded applications and industries.
J-Link debug probes are the preferred solution for optimizing both the debugging and flash programming experience. Users benefit from record-breaking flash loaders, RAM download speeds of up to 4 MB/s, and the ability to set an unlimited number of breakpoints in microcontroller flash memories. This combination of speed, flexibility, and reliability makes SEGGER's J-Link an essential tool for anyone working in embedded systems — from hobbyists and students to professional developers.
J-Trace streaming trace probes

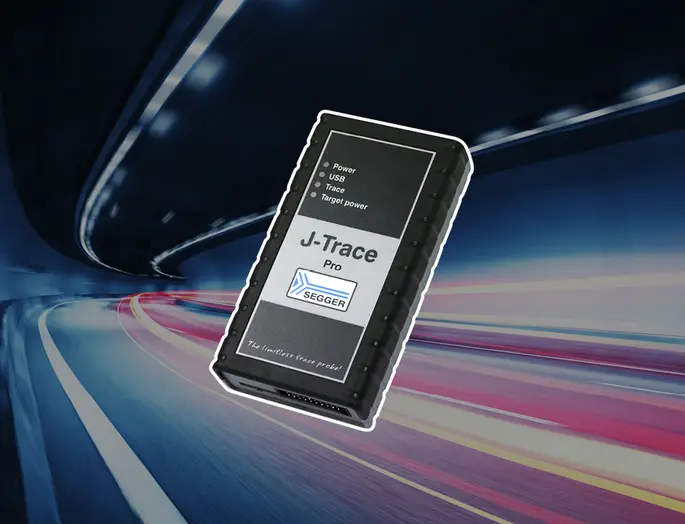
SEGGER's J-Trace is a professional streaming trace probe equipped with an extensive list of features that are tailored to meet the debugging needs of embedded developers and deliver the best possible tracing experience. With capabilities such as unlimited streaming trace, live code profiling, and live code coverage, J-Trace enables developers to effectively isolate and identify hard-to-find code defects.
With multi-platform support for Windows, macOS, and Linux, J-Trace is highly versatile. It is compatible with most popular IDEs, which helps ensure seamless integration into various development environments.
Supported devices
The list of supported manufacturers, families, devices, and SoCs includes tens of thousands of devices in hundreds of device families.
Device not listed? Please don’t hesitate to contact us.
Comparison
| Cortex-A/R trace | Cortex-M trace | RISC-V trace | Ethernet | WiFi | J-Flash | Ozone | Monitor Mode | Flash breakpoints | RTT | Max. download speed into RAM | Max. target interface speed | |
|---|---|---|---|---|---|---|---|---|---|---|---|---|
| J-Trace PRO | 4.0 MB/s | 50 MHz | ||||||||||
| J-Trace PRO Cortex | 4.0 MB/s | 50 MHz | ||||||||||
| J-Trace PRO Cortex-M | 4.0 MB/s | 50 MHz | ||||||||||
| J-Trace PRO RISC-V | 4.0 MB/s | 50 MHz | ||||||||||
| J-Link PRO PoE | 4.0 MB/s | 50 MHz | ||||||||||
| J-Link PRO | 4.0 MB/s | 50 MHz | ||||||||||
| J-Link ULTRA+ | 4.0 MB/s | 50 MHz | ||||||||||
| J-Link WiFi | 1.0 MB/s | 15 MHz | ||||||||||
| J-Link PLUS | 1.0 MB/s | 15 MHz | ||||||||||
| J-Link BASE | 1.0 MB/s | 15 MHz | ||||||||||
| J-Link EDU Mini | 200 KB/s | 4 MHz |
Get in touch with us
Have questions or need assistance? Our Embedded Experts are here to help!
Reach out to us for:
- Licensing quotes
- Technical inquiries
- Project support